ES_R DevKit 2 Operation ManualAcademic
This manual explains how to use "ES_R DevKit 2," an application for acquiring, visualizing, and recording data from JINS MEME ES_R devices.
Note: This app (ES_R DevKit 2) requires version 3 or later. If you are using version 2 or earlier, see the old version.
Downloading the Software
- Please download from here.
- Android 12 or later, devices with BLE4.2 or later
- Be sure to download version 3 or later.
Installation
- Open the downloaded apk file (if installation of apps from an unknown source is not allowed, please allow it).
- Tap
Installwhen the dialog box appears. - Tap
Openafter installation is complete. - Tap
Only when using appswhen the location grant dialog is displayed (location is used for BLE scanning and, when enabled in the settings, for recording your location). - Tap
Allowwhen the dialog for authorization of file access in the device is displayed. - Startup is complete.
1. Connection Settings (Standard BLE Connection)
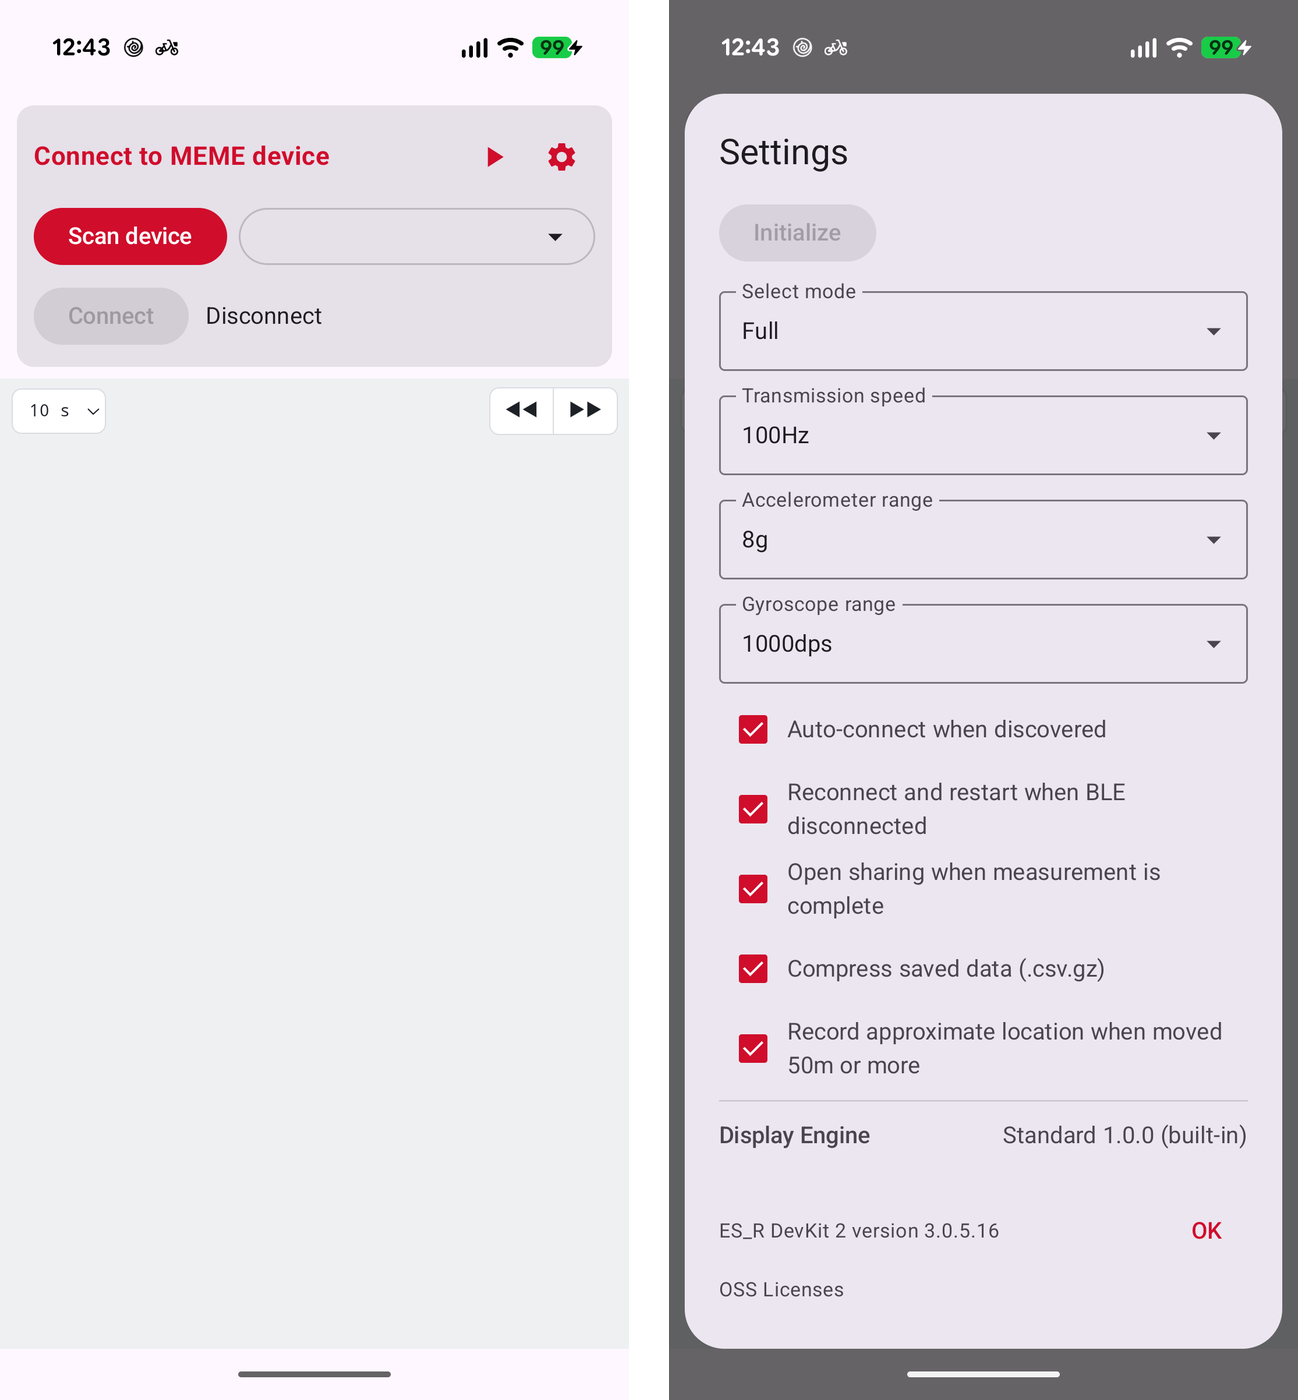
When you launch the app, the screen for configuring the connection with the device is displayed. The connection controls are at the top, and the graph view is below them.
Steps
- Tap the Scan device button to search for nearby JINS MEME devices.
- Select the target device from the dropdown list on the right.
- Tap the Connect button to start the connection.
- Once the connection is successful, the status changes to "Connected," and the device's firmware version is displayed.
If Auto-connect when discovered is enabled in the settings, the app connects automatically to a device found by the scan.
Tap Disconnect when you are finished.
Putting the ES_R into Shelf mode
While connected and not measuring, hold Disconnect down for 5 seconds. A confirmation dialog appears, and choosing Yes puts the ES_R into Shelf mode. Shelf mode stops pairing to save power and is used before shipping or long-term storage. The ES_R only leaves Shelf mode when it is charged; the app cannot bring it back.
2. Device Settings
Tap the gear icon (Settings) in the upper right to configure detailed measurement settings.
- Initialize: Resets various internal parameters of the device to their default values (only while connected).
- Select mode: Choose the type of data to be acquired (Standard, Full, Quaternion).
- Transmission speed: Sets the sampling rate.
- Accelerometer range: Sets the measurement range of the accelerometer.
- Gyroscope range: Sets the measurement range of the gyroscope.
- Auto-connect when discovered: Connects automatically to a device found by the scan.
- Reconnect and restart when BLE disconnected: When the BLE connection is lost, reconnects automatically and resumes the measurement (enabled by default).
- Open sharing when measurement is complete: Opens the share sheet for the saved file after the measurement stops.
- Compress saved data (.csv.gz): Saves measurement data compressed with gzip (enabled by default).
- Record approximate location when moved 50m or more: During measurement, records your approximate location each time you move 50m or more (see 4. Data Storage).
The app version and OSS Licenses (licenses of the open-source software used in the app) are at the bottom of the dialog.
3. Measurement and Graph Display
Once the connection with the device is complete, operate the app from the "Measure" section.
Starting and Stopping Measurement
- Start Measurement: Long-press the button (until the bar reaches the right edge) to start measurement and recording.
- Stop Measurement: Long-press the button during measurement to stop recording.
- Free Marking: Tap this button during measurement to put
Xin theARTIFACTcolumn at that moment; the mark also appears on the graphs.
During measurement, the number of recorded rows (Recording(…)) and the ES_R battery level are shown to the right of "Measure", and the reception success rate (SUCCESS RATE) and the recent communication rate (COMM RATE) are shown below the buttons.
Data Visualization
During measurement, the EOG (electrooculography, Vv / Vh), accelerometer, and gyroscope data are shown in real-time graphs according to the mode (EOG and accelerometer in Standard mode, no graphs in Quaternion mode).
| Control | Description |
|---|---|
Display width at the top left (10 s etc.) | Chooses the horizontal (time) display width from 60 / 30 / 15 / 10 seconds (10 seconds by default) |
| Horizontal pinch | Zooms the horizontal (time) axis in and out |
Horizontal drag, ◀◀ / ▶▶ | Moves earlier or later in time |
| Vertical pinch | Zooms the vertical (amplitude) axis of that graph in and out |
| Gear at the top right of each graph | Vertical axis settings for that graph (zoom in/out, auto-fit, reset) |
∧ / ∨ at the top left of each graph | Collapses or expands the graph |
| Tapping a graph | Adds an artifact (see below) |
A vertical drag scrolls the screen. The graphs also work with the smartphone in landscape orientation.
Adding an Artifact
Tap a graph to open the "Add artifact" input field at the bottom of the screen, where you can put any text on the row you tapped. Leave it empty and tap Add to enter X. This works both during measurement and during playback.
- Marks added during measurement are written to the
ARTIFACTcolumn of the saved CSV when the measurement stops. - Marks added during playback are written back to the CSV being played when you end the playback (Disconnect).
- Up to 64 characters can be entered. Commas and line breaks are replaced with spaces, and text starting with
=+-@cannot be entered (so that a spreadsheet does not read it as a formula).
4. Data Storage
When measurement is stopped, the data is saved as a gzip-compressed CSV (.csv.gz). The contents are exactly the same as the previous CSV format; compression simply makes the file smaller (about 1/3 in our measurements).
Storage Location
Inside the Download / ESR Logger folder of the device's internal storage.
File Name Format
[DeviceAddress]_[UTC DateTime].csv.gz
To save uncompressed .csv files as before, clear the Compress saved data (.csv.gz) checkbox in the settings. The file name then becomes [DeviceAddress]_[UTC DateTime].csv.
If Open sharing when measurement is complete is enabled in the settings, the share sheet opens after the measurement stops, so you can send the file straight to email or cloud storage.
Recording Your Location
If Record approximate location when moved 50m or more is enabled in the settings, each time you move 50m or more during measurement your approximate location is recorded in the ARTIFACT column of that row as lc:latitude_longitude (for example lc:35.6802_139.7521). It is disabled by default.
Opening Compressed Files
.csv.gz is a standard gzip file, so no special tool is required.
| Purpose | How |
|---|---|
| Extract on a computer | Archivers such as 7-Zip or The Unarchiver. On macOS, double-clicking also works |
| Command line | gzip -d [FileName].csv.gz |
| Python (pandas) | pd.read_csv("data.csv.gz") — decompressed automatically based on the extension |
The app's playback mode reads both .csv.gz and .csv as-is.
5. Playback Mode
A mode for selecting previously saved CSV data and reviewing it on the same graph view you use while measuring. Use this when the device is not on hand, or to review acquired data.
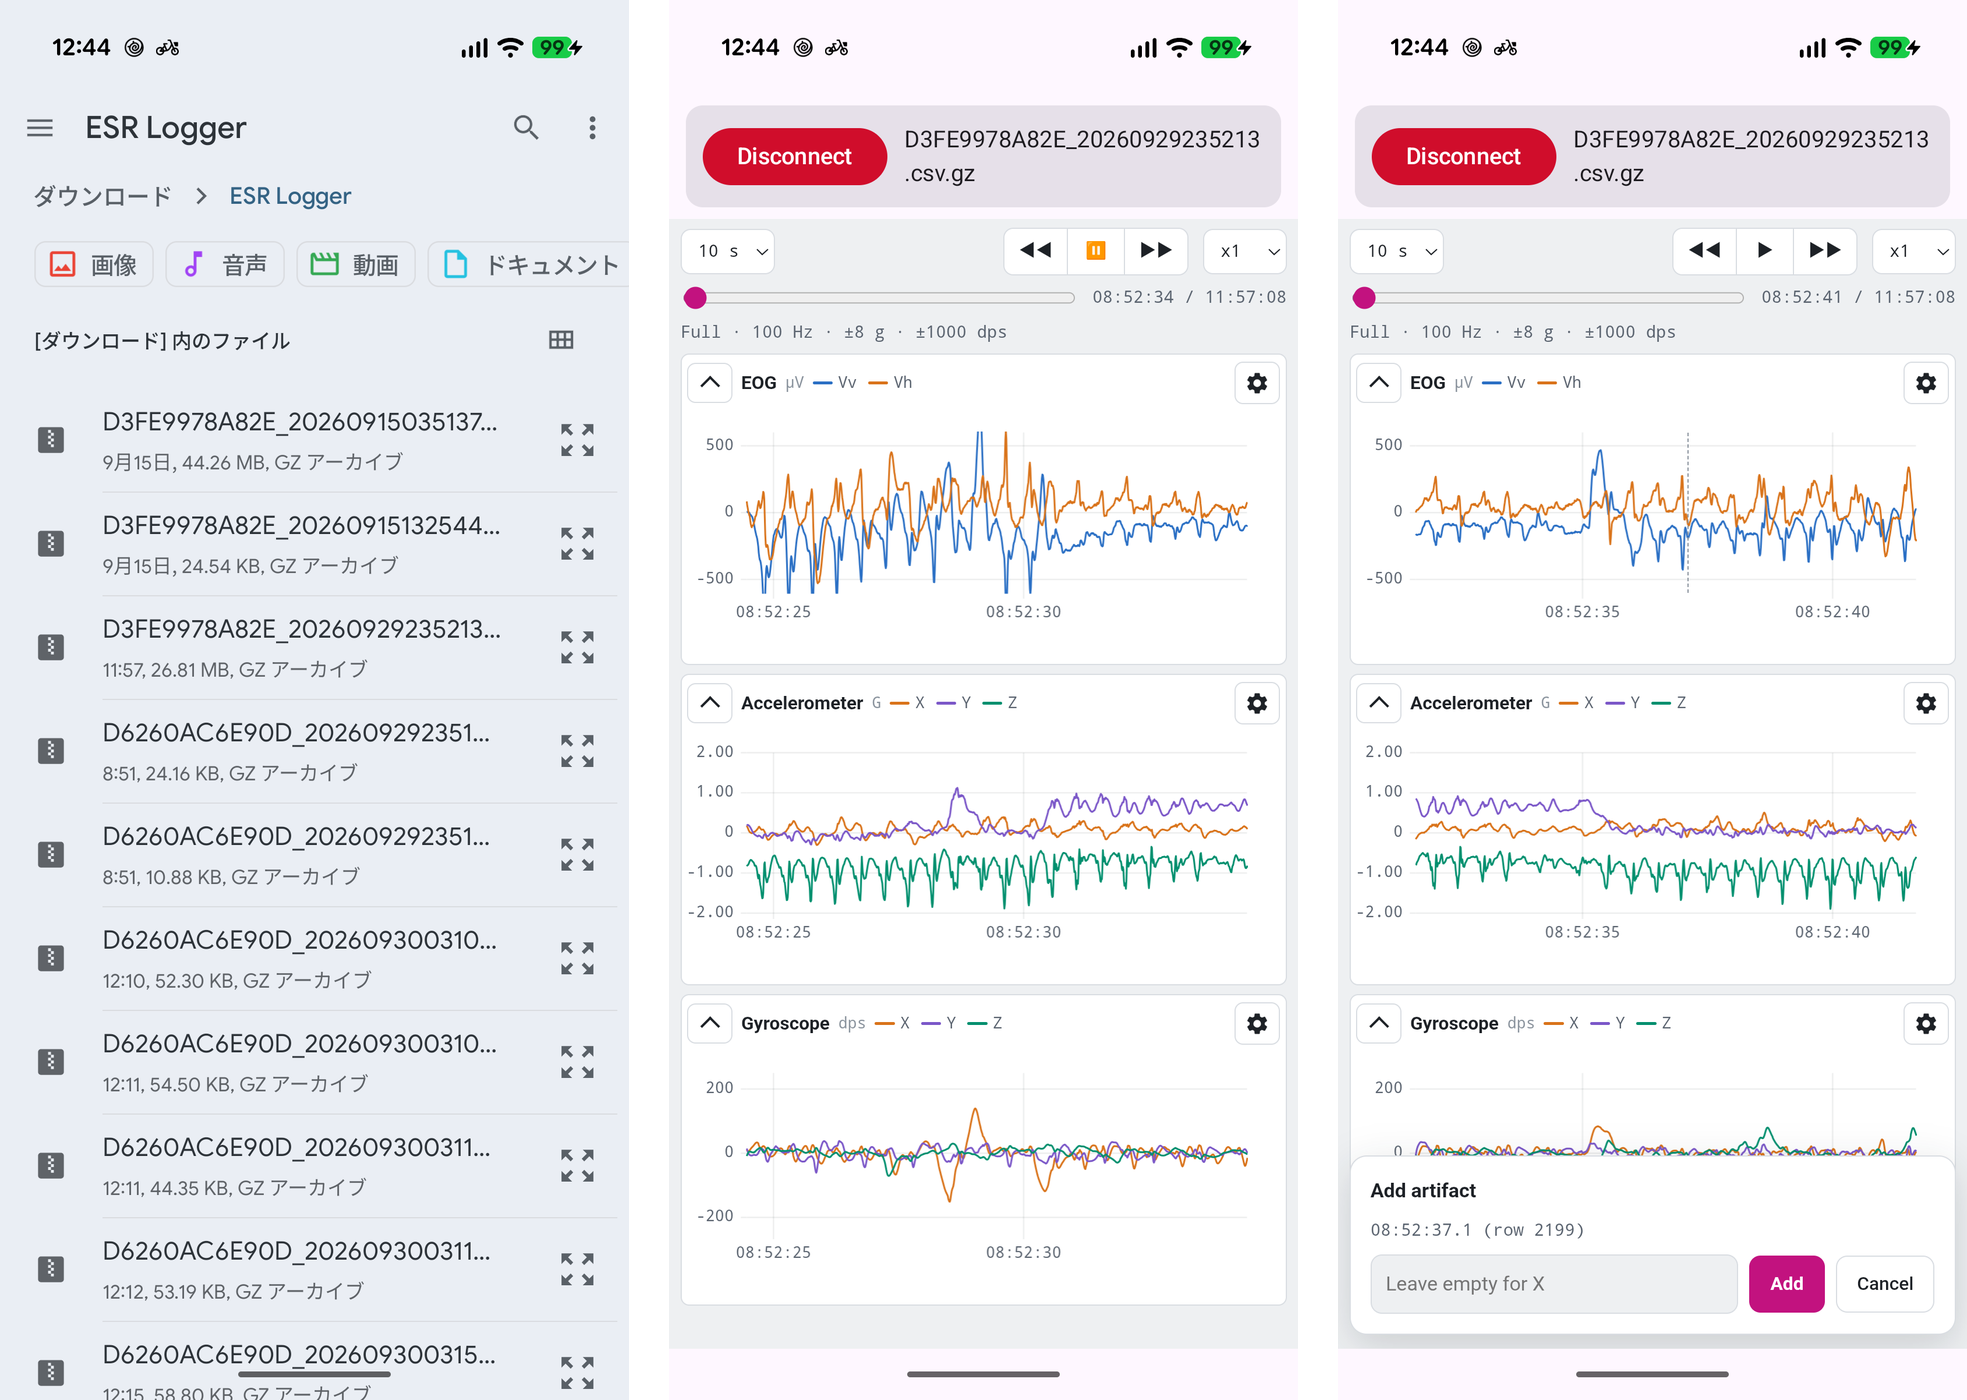
Steps
- Tap the playback icon (▶︎) in the upper right of the screen.
- The file selection screen opens; select the file you want to play back. Either
.csv.gz(compressed) or.csv(uncompressed) works. - Playback starts as soon as you choose the file. The file name is shown at the top.
- Tap Disconnect to end the playback. Artifacts added during playback are written back to the CSV being played at this point.
Controls During Playback
| Control | Description |
|---|---|
| Position slider | Changes the playback position. The current time and the time at the end of the file are shown on the right |
▶ / ⏸ | Plays and pauses |
◀◀ / ▶▶ | Moves back or forward by half the display width |
x1 | Chooses the playback speed from x1 / x2 / x4 / x8 / x16 / x32 |
- Times on the graphs are shown in the smartphone's local time (the
DATEcolumn of the CSV is recorded in UTC). - Rows with a value in the
ARTIFACTcolumn of the CSV are overlaid on the graph as a vertical line with a label.