Using with a PCAcademic
This page explains how to use the PC logger, which acquires data from the JINS MEME ES_R, visualizes it in real time, and records it to CSV.
No USB dongle is required. The app connects to the ES_R directly through the Bluetooth LE radio built into your PC.
Note: If you are using the older app that requires a USB dongle, see the manual for the old version. The screen layout is very different.
Operating environment
| Item | Requirement |
|---|---|
| Supported OS (Windows) | Microsoft Windows 11 or later 64bit Memory: 4GB or more (8GB recommended) |
| Supported OS (macOS) | macOS 14 or later Memory: 4GB or more (8GB recommended) |
| Hardware | A Bluetooth adapter with BLE support (the one built into your PC is fine) |
| Dongle | Not required |
Download
Please download from here.
| OS | File |
|---|---|
| Windows | JINS_MEME_DataLogger_Setup.exe (installer) |
| macOS | A dmg packed into a zip |
Installation
Windows
- Double-click the downloaded
JINS_MEME_DataLogger_Setup.exe.ImportantInstallation requires administrator privileges. Click [Yes] when the [User Account Control] window appears. If you are logged in with a non-administrator account, ask your administrator to perform the installation.
- Choose the language (Japanese / English) and follow the wizard.
- Specify the installation destination (
C:\Program Files\JINS MEME DataLoggerby default), the Start menu folder name, and whether to create a desktop icon. - Click [Install].
TipIf the .NET 10 Desktop Runtime is not present on your PC, the installer downloads and installs it automatically. This runs after you finish the wizard pages, so it can take a few minutes. An internet connection is required.
- Click [Finish] on the completion screen.
To uninstall, select JINS MEME DataLogger from the Windows [Apps] list and remove it.
Updating
Automatic updates are not supported. Simply run the installer for the new version and it will install over the existing one.
macOS
- Extract the downloaded zip and open the dmg inside it.
- Drag the app onto the [Applications] folder.
- Launch it from the [Applications] folder.
- Allow Bluetooth access when prompted on first launch.
To uninstall, delete the app from the [Applications] folder.
Screen layout
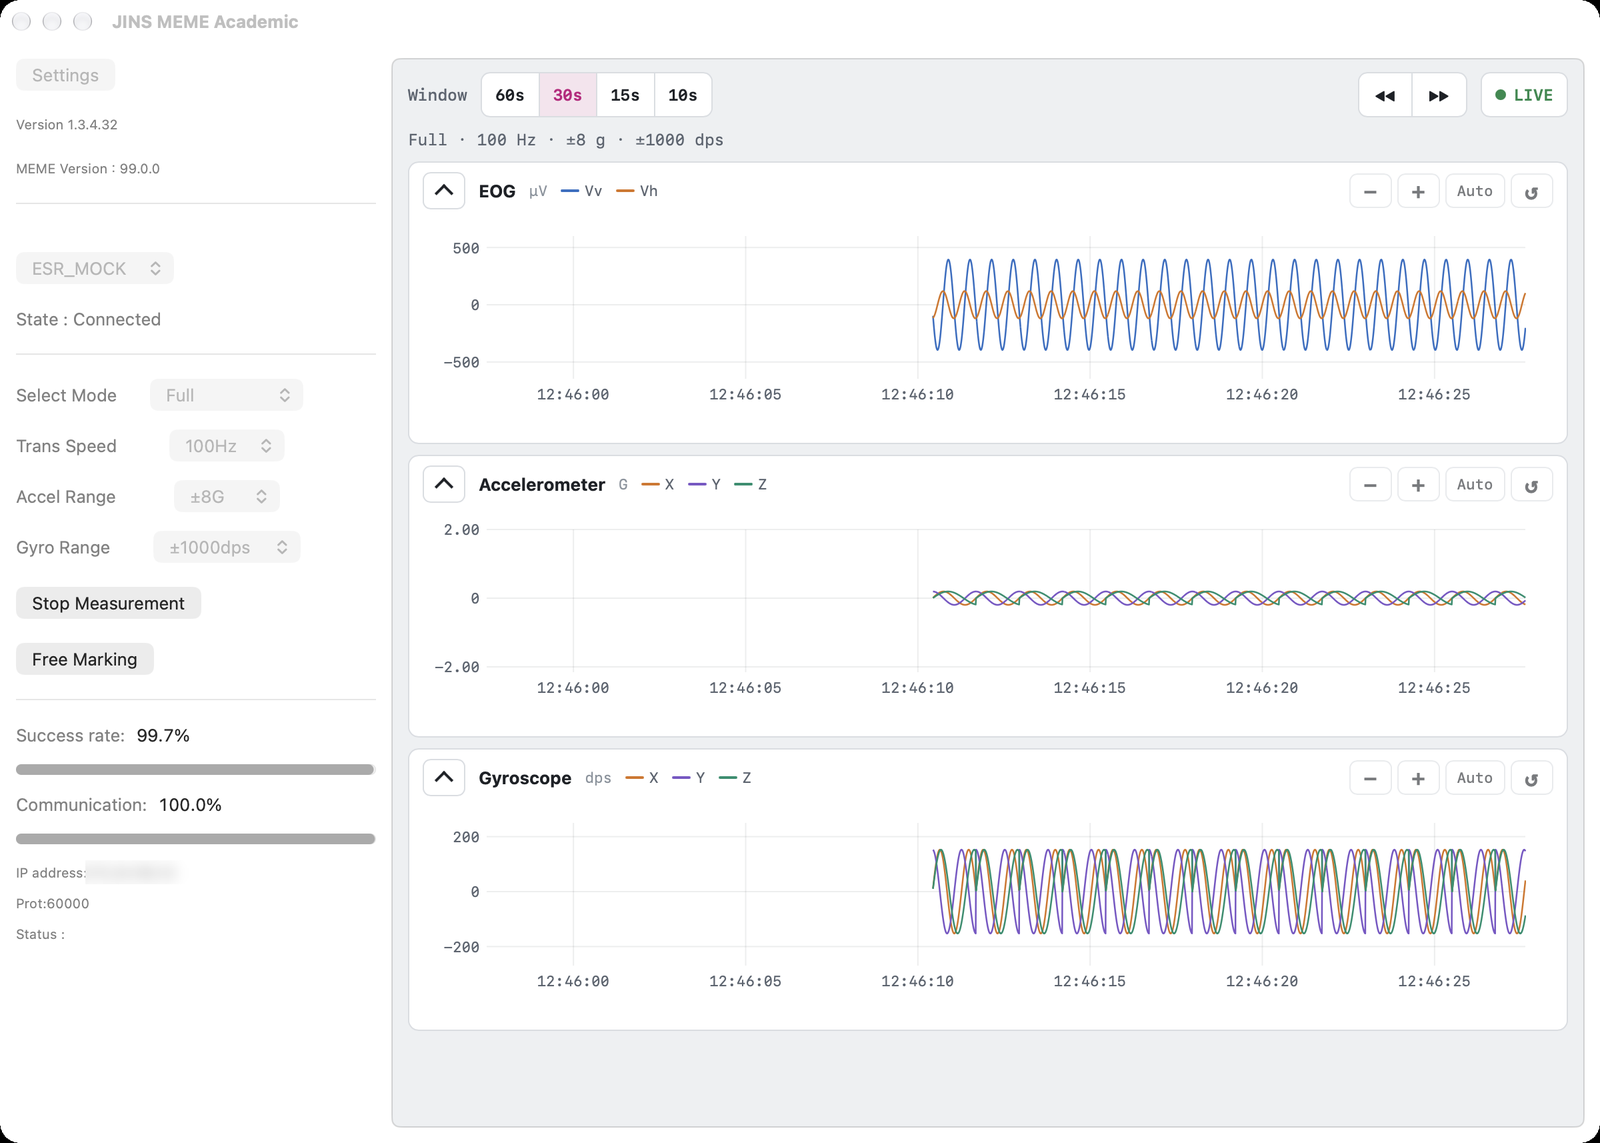
The left column holds the connection and measurement controls, and the graph view is on the right. The Windows and macOS versions share the same layout (the image above is the macOS version).
| Location | Description |
|---|---|
Setting (S) (menu bar on Windows) / Settings (button at the top left on macOS) | Opens the settings window (save location, TCP output, and so on) |
Version (V) (menu bar on Windows) | Shows the application version |
| Top of the left column | The application version and the firmware version of the connected ES_R |
Scan (Start Scan on macOS) / File Replay / Connect | Scan for and connect to a device, or replay a recorded CSV |
State : | Connection state (Disconnected / Connected, or the file name while replaying) |
Select Mode and below | Measurement settings |
Start Measurement / Free Marking | Start and stop measurement, add an artifact |
Save Artifacts | Shown only during replay. Writes the artifacts you added on the graphs back to the CSV being replayed |
Success rate / Communication | Data acquisition rate, cumulative and recent |
IP address / Port / Status | TCP output status |
| Graph view | Display width, replay controls, and the waveform graphs (see Working with the graphs) |
The graph view shows only the graphs for which the current mode has data.
| Mode | Graphs shown |
|---|---|
Full | EOG, Accelerometer, Gyroscope |
Standard | EOG, Accelerometer |
Quaternion | None ("No charts for this mode" is shown) |
Connecting
- Charge the ES_R and put it into pairing mode with the glasses held the right way up.
- Click
Scan. Devices that are found are listed in the combo box asESRG2_0 (mac_address).- The device is not always found on the first try. Click
Scanagain if nothing appears.
- The device is not always found on the first try. Click
- Select the device you want and click
Connect. - Once connected,
State :changes toConnectedand the firmware version of the ES_R is shown.
Click Disconnect when you are finished.
Putting the ES_R into Shelf mode
While connected and not measuring, hold Disconnect down for 5 seconds. A confirmation dialog appears, and choosing Yes puts the ES_R into Shelf mode. Shelf mode stops pairing to save power and is used before shipping or long-term storage. The ES_R only leaves Shelf mode when it is charged; the app cannot bring it back.
The ES_R can only be connected to one host at a time
If a smartphone app or similar is connected, disconnect it first.
Measuring
Setting the measurement conditions
When you connect, the current values are read from the ES_R and reflected in each field. Change them as needed before you start measuring.
| Item | Description |
|---|---|
Select Mode | Data mode. Standard / Full / Quaternion |
Trans Speed | Sampling frequency. 100Hz / 50Hz |
Accel Range | Accelerometer measurement range. ±2 / ±4 / ±8 / ±16 G |
Gyro Range | Gyroscope measurement range. ±250 / ±500 / ±1000 / ±2000 dps |
Operating sensors per mode
| Mode | Operating sensors | Graphs |
|---|---|---|
Standard | Electrooculography sensor, accelerometer | Yes (both EOG samples in each packet are drawn) |
Full | Electrooculography sensor, accelerometer, gyroscope | Yes |
Quaternion | Quaternion output | No (there is no waveform to plot, so "No charts for this mode" is shown) |
Starting and stopping measurement
- Click
Start Measurementto begin measuring and recording to CSV. - The button changes to
Stop Measurementwhile measuring. Click it again to stop and finalize the CSV. Select Modeand the other settings cannot be changed during measurement.
Adding an artifact
You can mark positions in the data — a movement by the subject, an external event — so that you can find them later. There are two ways to do it.
The Free Marking button — clicking it puts X in the ARTIFACT column of the next row, and the mark also appears on the graphs. It works only during measurement (on Windows the button is disabled outside measurement; on macOS it only appears while measuring).
Clicking a graph — clicking without dragging opens an input field below the graph view, where you can put any text on the row you clicked. Leave it empty and press Add to enter X. This works both during measurement and during replay.

Marks appear on the graph immediately as a vertical line with a label, and are written back to the CSV together at the following times.
| Situation | Written back when | Written back to |
|---|---|---|
| Measuring | Stop Measurement or disconnection | The CSV saved for that measurement |
| Replaying | Save Artifacts or Disconnect | The CSV being replayed |
- Up to 64 characters can be entered. Commas and line breaks are replaced with spaces so that the columns do not break.
- Text starting with
=+-@cannot be entered (so that a spreadsheet does not read it as a formula). - Marking the same row repeatedly overwrites it with the last value you entered.
- The
XfromFree Markingis written to the CSV as soon as the data arrives, so it is not part of the write-back. - The write-back goes to a temporary file which then replaces the original, so the CSV is not corrupted if it fails partway.
Checking the communication status
| Indicator | Description |
|---|---|
Success rate | Cumulative data acquisition rate since the measurement started |
Communication | Data acquisition rate over the last second |
If the numbers drop significantly, try moving the PC closer to the ES_R or lowering Trans Speed to 50Hz.
Working with the graphs
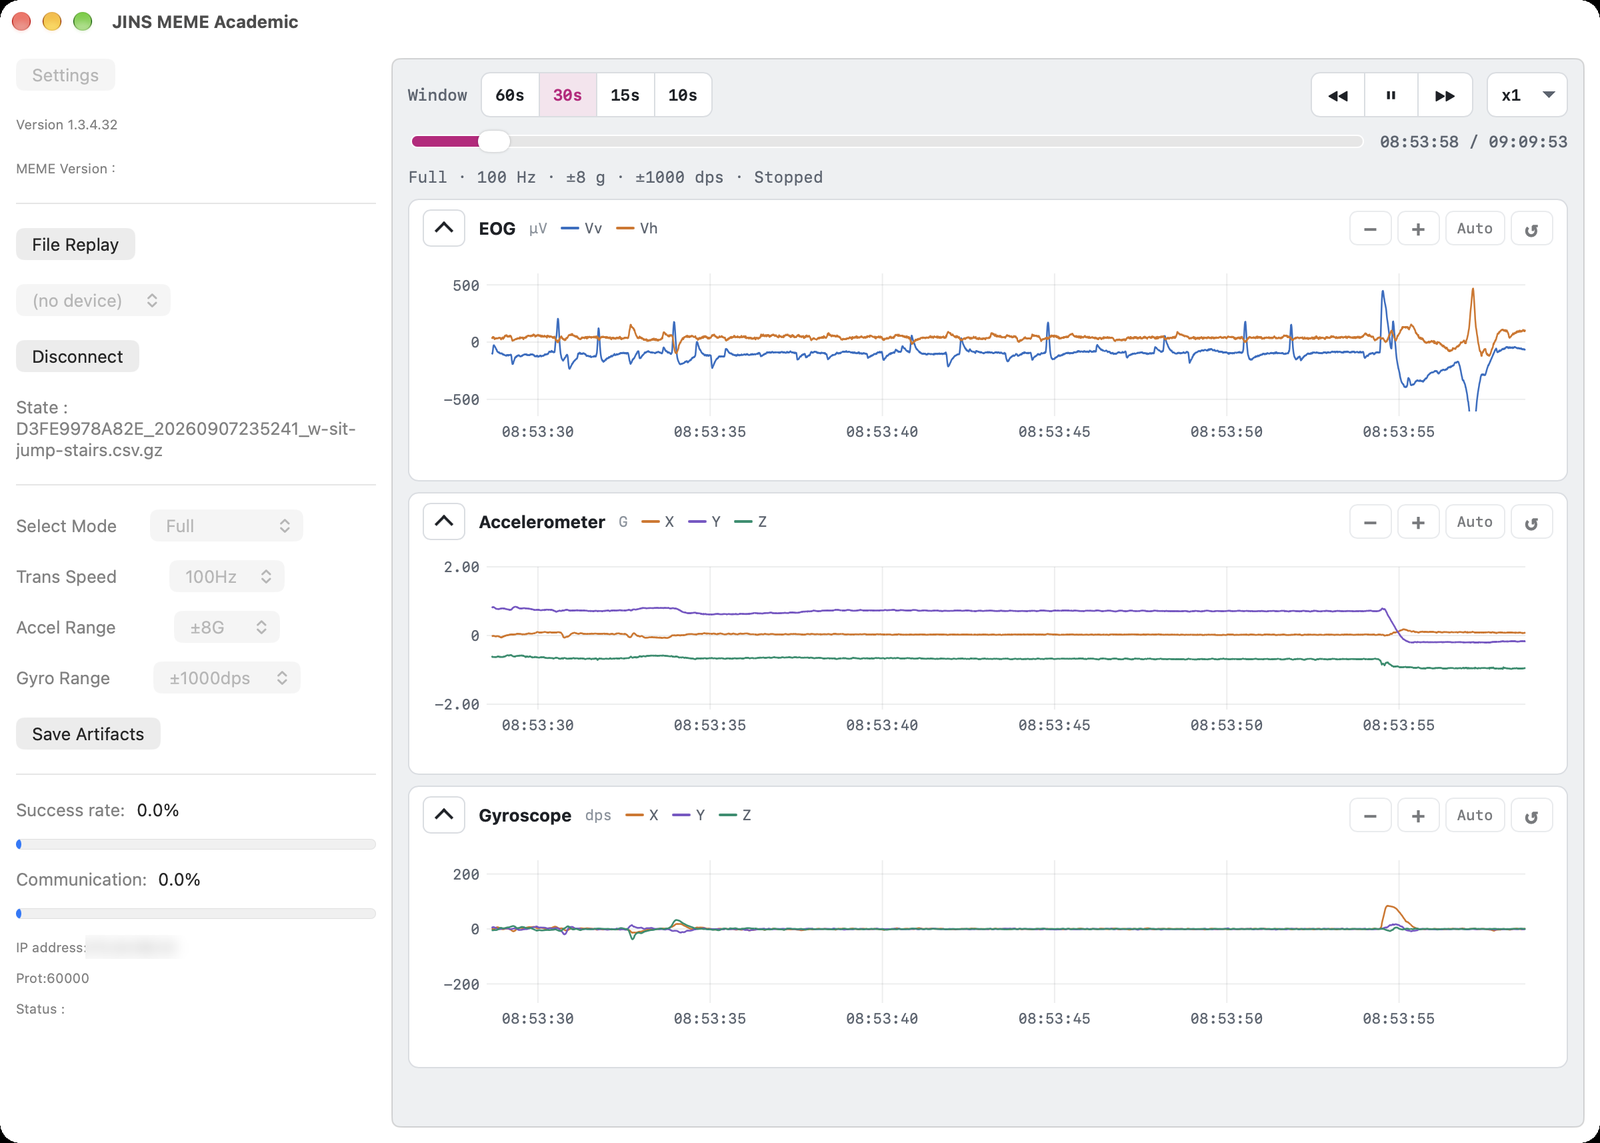
The graphs share one time axis, and horizontal (time) operations apply to all of them at once. Waveforms are drawn from every sample, with no thinning (so that the mains hum stays visible and you can judge the electrode contact by eye).
| Control | Description |
|---|---|
60s / 30s / 15s / 10s next to Window | Switches the horizontal (time) display width (30 seconds by default) |
| Ctrl (⌘ on macOS) + wheel, trackpad pinch | Zooms the horizontal (time) axis in and out |
Dragging on a graph, Shift + wheel, ◀◀ / ▶▶ | Moves earlier or later in time (◀◀ / ▶▶ move by half the display width) |
LIVE / Back to LIVE | During measurement you can scroll back up to the last 30 minutes. While you are looking at the past the button reads Back to LIVE; press it to return to the latest data |
− / + on each graph | Zooms the vertical (amplitude) axis out and in. Using the wheel over the vertical axis also zooms |
| Dragging the vertical axis | Moves the graph vertically |
Auto | Keeps fitting the vertical axis to the visible waveform (press again to turn it off) |
↺ | Resets the vertical axis of that graph. Reset view on the control bar resets both time and all vertical axes |
∧ / ∨ to the left of the title | Collapses or expands the graph |
| Clicking a graph (without dragging) | Adds an artifact (see Adding an artifact) |
The EOG graph shows the vertical (Vv) and horizontal (Vh) eye potentials in µV; the accelerometer is shown in G and the gyroscope in dps.
The recorded CSV
Save location and file name
| OS | Default save location |
|---|---|
| Windows | Documents\JINS\MEME_Academic |
| macOS | ~/Documents/JINS/MEME_Academic |
The location can be changed with Save File Path in Setting. On both platforms the file name is <MAC address>_<UTC datetime>.csv.gz.
If you enable Save Dialog in Setting, a dialog to choose the save location again appears after the measurement ends.
Compressed format (.csv.gz)
Measurement data is saved as a gzip-compressed CSV (.csv.gz) — Save Format in Setting is enabled by default. The contents are exactly the same as the previous CSV format; compression simply makes the file smaller.
To save uncompressed .csv files as before, clear Save Format in Setting. The file name then becomes <MAC address>_<UTC datetime>.csv.
.csv.gz is a standard gzip file, so no special tool is required.
| Purpose | How |
|---|---|
| Extract | Archivers such as 7-Zip or The Unarchiver. On macOS, double-clicking also works |
| Command line | gzip -d <FileName>.csv.gz |
| Python (pandas) | pd.read_csv("data.csv.gz") — decompressed automatically based on the extension |
Files stay readable even if a measurement is cut short
Compression is completed for each flush and then appended, so the file remains readable up to that point even if the app is force-quit or the BLE link drops.
Columns
The format is shared with the Mac and Android versions (the following shows the contents after decompression). The columns depend on the mode.
| Mode | Columns |
|---|---|
| Standard | ARTIFACT,NUM,DATE,ACC_X,ACC_Y,ACC_Z,EOG_L1,EOG_R1,EOG_L2,EOG_R2,EOG_H1,EOG_H2,EOG_V1,EOG_V2 |
| Full | ARTIFACT,NUM,DATE,ACC_X,ACC_Y,ACC_Z,GYRO_X,GYRO_Y,GYRO_Z,EOG_L,EOG_R,EOG_H,EOG_V |
| Quaternion | ARTIFACT,NUM,DATE,QUATERNION_W,QUATERNION_X,QUATERNION_Y,QUATERNION_Z |
A header describing the measurement conditions is written at the top of the file.
// Data mode  : Full
// Transmission speed  : 100Hz
// Acceleration sensor's range  : 2g
// Gyroscope sensor's range  : 250dps
//
//ARTIFACT,NUM,DATE,ACC_X,ACC_Y,ACC_Z,GYRO_X,GYRO_Y,GYRO_Z,EOG_L,EOG_R,EOG_H,EOG_V
,1,2026/08/27 04:27:10.21,-200,-3415,-2284,178,-343,763,2007,2001,6,-2004DATEis recorded in UTC. To show local time on the graphs only, useTime DisplayinSetting(the recorded values always stay in UTC).NUMis a monotonically increasing value accumulated from the difference of the device-side counter. Numbers are skipped when packets are dropped.ARTIFACTholds the marks added withFree Markingor by clicking a graph.- Rows are flushed every 100 rows at 100Hz, or every 50 rows at 50Hz, because opening and closing the file for each row would drop data. The remainder is flushed when the measurement stops. For
.csv.gz, each of these flushes is one unit of compression.
File Replay
You can load a recorded CSV and review it on the same screen you use while measuring, even without a device at hand.
Starting a replay
- Click
File Replay. - Choose a file in the file dialog. Either
.csv.gz(compressed) or.csv(uncompressed) works — there is no need to extract it first. - Playback starts as soon as you choose the file (there is no Start button).
Select Modeand the other fields switch to the conditions recorded in the file, andState :shows the file name.
Only CSVs in this app's format (shared with the Mac and Android versions) can be loaded. CSVs written by the old Windows app — with the // Accelerometer sensor's range wording or a BattLv column — can also be read.
Whether a file is compressed is determined by its contents rather than its extension, so a .csv.gz file renamed to .csv still opens.
On Windows you can also start a replay by right-clicking a .csv / .csv.gz file in File Explorer and choosing [Open with].
Controls during replay
The replay controls are on the control bar at the top of the graph view.
| Control | Description |
|---|---|
| Position slider | Changes the playback position. The current time and the time at the end of the file are shown on the right |
▶ / ⏸ | Plays and pauses |
◀◀ / ▶▶ | Moves back or forward by half the display width |
x1 | Chooses the playback speed from x1 / x2 / x4 / x8 / x16 / x32 |
Save Artifacts (left column) | Writes the artifacts added during replay back to the CSV being replayed |
Disconnect (left column) | Ends the replay. The artifacts you added are also written back at this point |
- The horizontal axis is drawn from the
DATEcolumn (UTC) of the CSV, so the recorded times are shown as they are (enableTime Displayto show local time). - Rows with a value in the
ARTIFACTcolumn are overlaid on the graph as a vertical line with a label. - Raising the playback speed does not thin the data. Fine detail in the waveform (such as the mains hum) survives even at x32.
You can also click a graph during replay to add an artifact (see Adding an artifact).
About cutting out a range
The "drag to cut out a range" feature of earlier versions has been removed. Add artifacts at the start and end of the range and cut it out in your analysis instead.
Setting
Open it from Setting (S) on the menu bar on Windows, or from the Settings button at the top left on macOS.
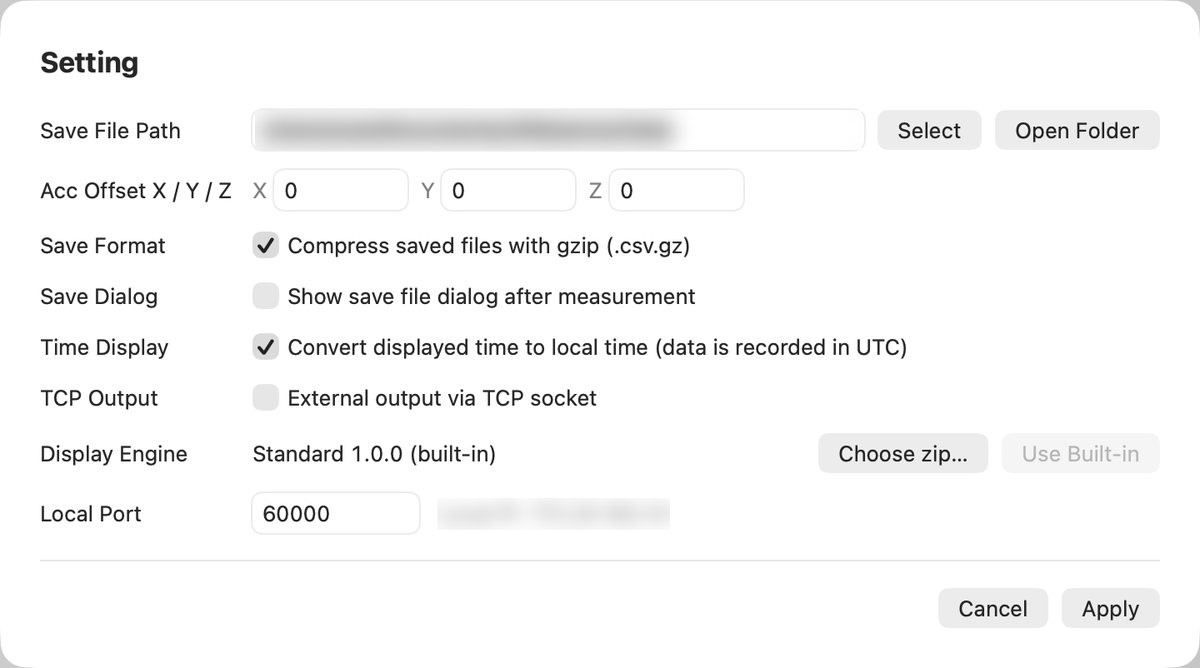
| Item | Description |
|---|---|
Save File Path | Where CSVs are saved. Documents\JINS\MEME_Academic on Windows and ~/Documents/JINS/MEME_Academic on macOS by default. On macOS, Select chooses a different folder and Open Folder opens the save location in Finder |
Acc Offset X / Y / Z | An offset added to the graph display only. The values recorded in the CSV do not change |
Save Format | Saves measurement data gzip-compressed as .csv.gz (enabled by default). Clear it to save .csv. Loading supports both regardless of this setting |
Save Dialog | Shows a dialog to choose the save location again after the measurement ends |
Time Display | Shows the horizontal axis in local time (recording is always in UTC) |
TCP Output | Streams the measurement data to an external client over TCP |
Local Port | The listening port. 88 by default |
The settings are restored the next time the app starts. They are stored in %APPDATA%\JINS\MEME_Academic\settings.json on Windows, and in the app preferences (UserDefaults) on macOS.
TCP output
When TCP Output is enabled, the app starts listening on the specified port (Status : in the left column shows Listen). Once a client connects it changes to Accepted, and the header and rows are streamed in exactly the same format as the CSV.
- If the client connected before the measurement started, the header is sent when the measurement starts.
- Only one client is accepted at a time.
- The streamed data is always uncompressed text. The
Save Formatsetting applies only to saved files and has no effect on the TCP output.
$ ncat 127.0.0.1 88
// Data mode  : Full
// Transmission speed  : 100Hz
// Acceleration sensor's range  : 2g
// Gyroscope sensor's range  : 250dps
//
//ARTIFACT,NUM,DATE,ACC_X,ACC_Y,ACC_Z,GYRO_X,GYRO_Y,GYRO_Z,EOG_L,EOG_R,EOG_H,EOG_V
,1,2026/08/27 04:27:10.21,-200,-3415,-2284,178,-343,763,2007,2001,6,-2004
Socket client sample in Python
import socket

target_ip = "127.0.0.1"   # IP address of the PC running the logger
target_port = 88          # Match Local Port in Setting
buffer_size = 4096

tcp_client = socket.socket(socket.AF_INET, socket.SOCK_STREAM)
tcp_client.connect((target_ip, target_port))

is_end = False
while not is_end:
    response = tcp_client.recv(buffer_size)
    if response == b"":
        is_end = True
    print("[*]Received a response : {}".format(response))

tcp_client.close()
Checking the version
The application version and the firmware version of the connected ES_R (MEME Version) are shown at the top of the left column. On Windows you can also check it from Version (V) on the menu bar. Please include this version when you contact us.
Troubleshooting
| Symptom | What to try |
|---|---|
Scan finds nothing | Check that the ES_R is charged and in pairing mode, and that Bluetooth is turned on for your PC |
| Another app has the device | The ES_R can only be connected to one host at a time. Disconnect any smartphone app that is connected |
| It connects but no data arrives | Remove the ES_R once from [Settings > Bluetooth & devices] on Windows and scan again. This can clear a stale GATT cache |
| The acquisition rate stays low | Move the PC closer to the ES_R, lower Trans Speed to 50Hz, or avoid congestion in the 2.4GHz band |
| No graphs are shown (Windows) | The graph view uses the Microsoft Edge WebView2 Runtime. It comes with Windows 11, but if it has been removed, follow the instructions shown where the graphs would be to install it, then restart the app |
| Runtime installation fails during setup | The automatic install cannot run without an internet connection. Install the .NET 10 Desktop Runtime manually and run the installer again |