Academic(ES-R) Logger for PC (Old version)Academic
You can record data acquired from the JINS MEME ES_R on your PC.
Note: This page describes the old app that requires a USB dongle. If you are using the newer app, which needs no dongle and talks to the ES_R through the Bluetooth radio built into your PC, see the manual for the new app.
Download the software
Please download from here.
Software operating environment
| OS | Operating environment |
|---|---|
| Supported OS (Windows) | Microsoft Windows 11 or later 64bit Memory: 4GB or more (8GB recommended) |
| Supported OS (MacOS) | MacOS 14 or later 64bit Memory: 4GB or more (8GB recommended) |
Installation
Windows
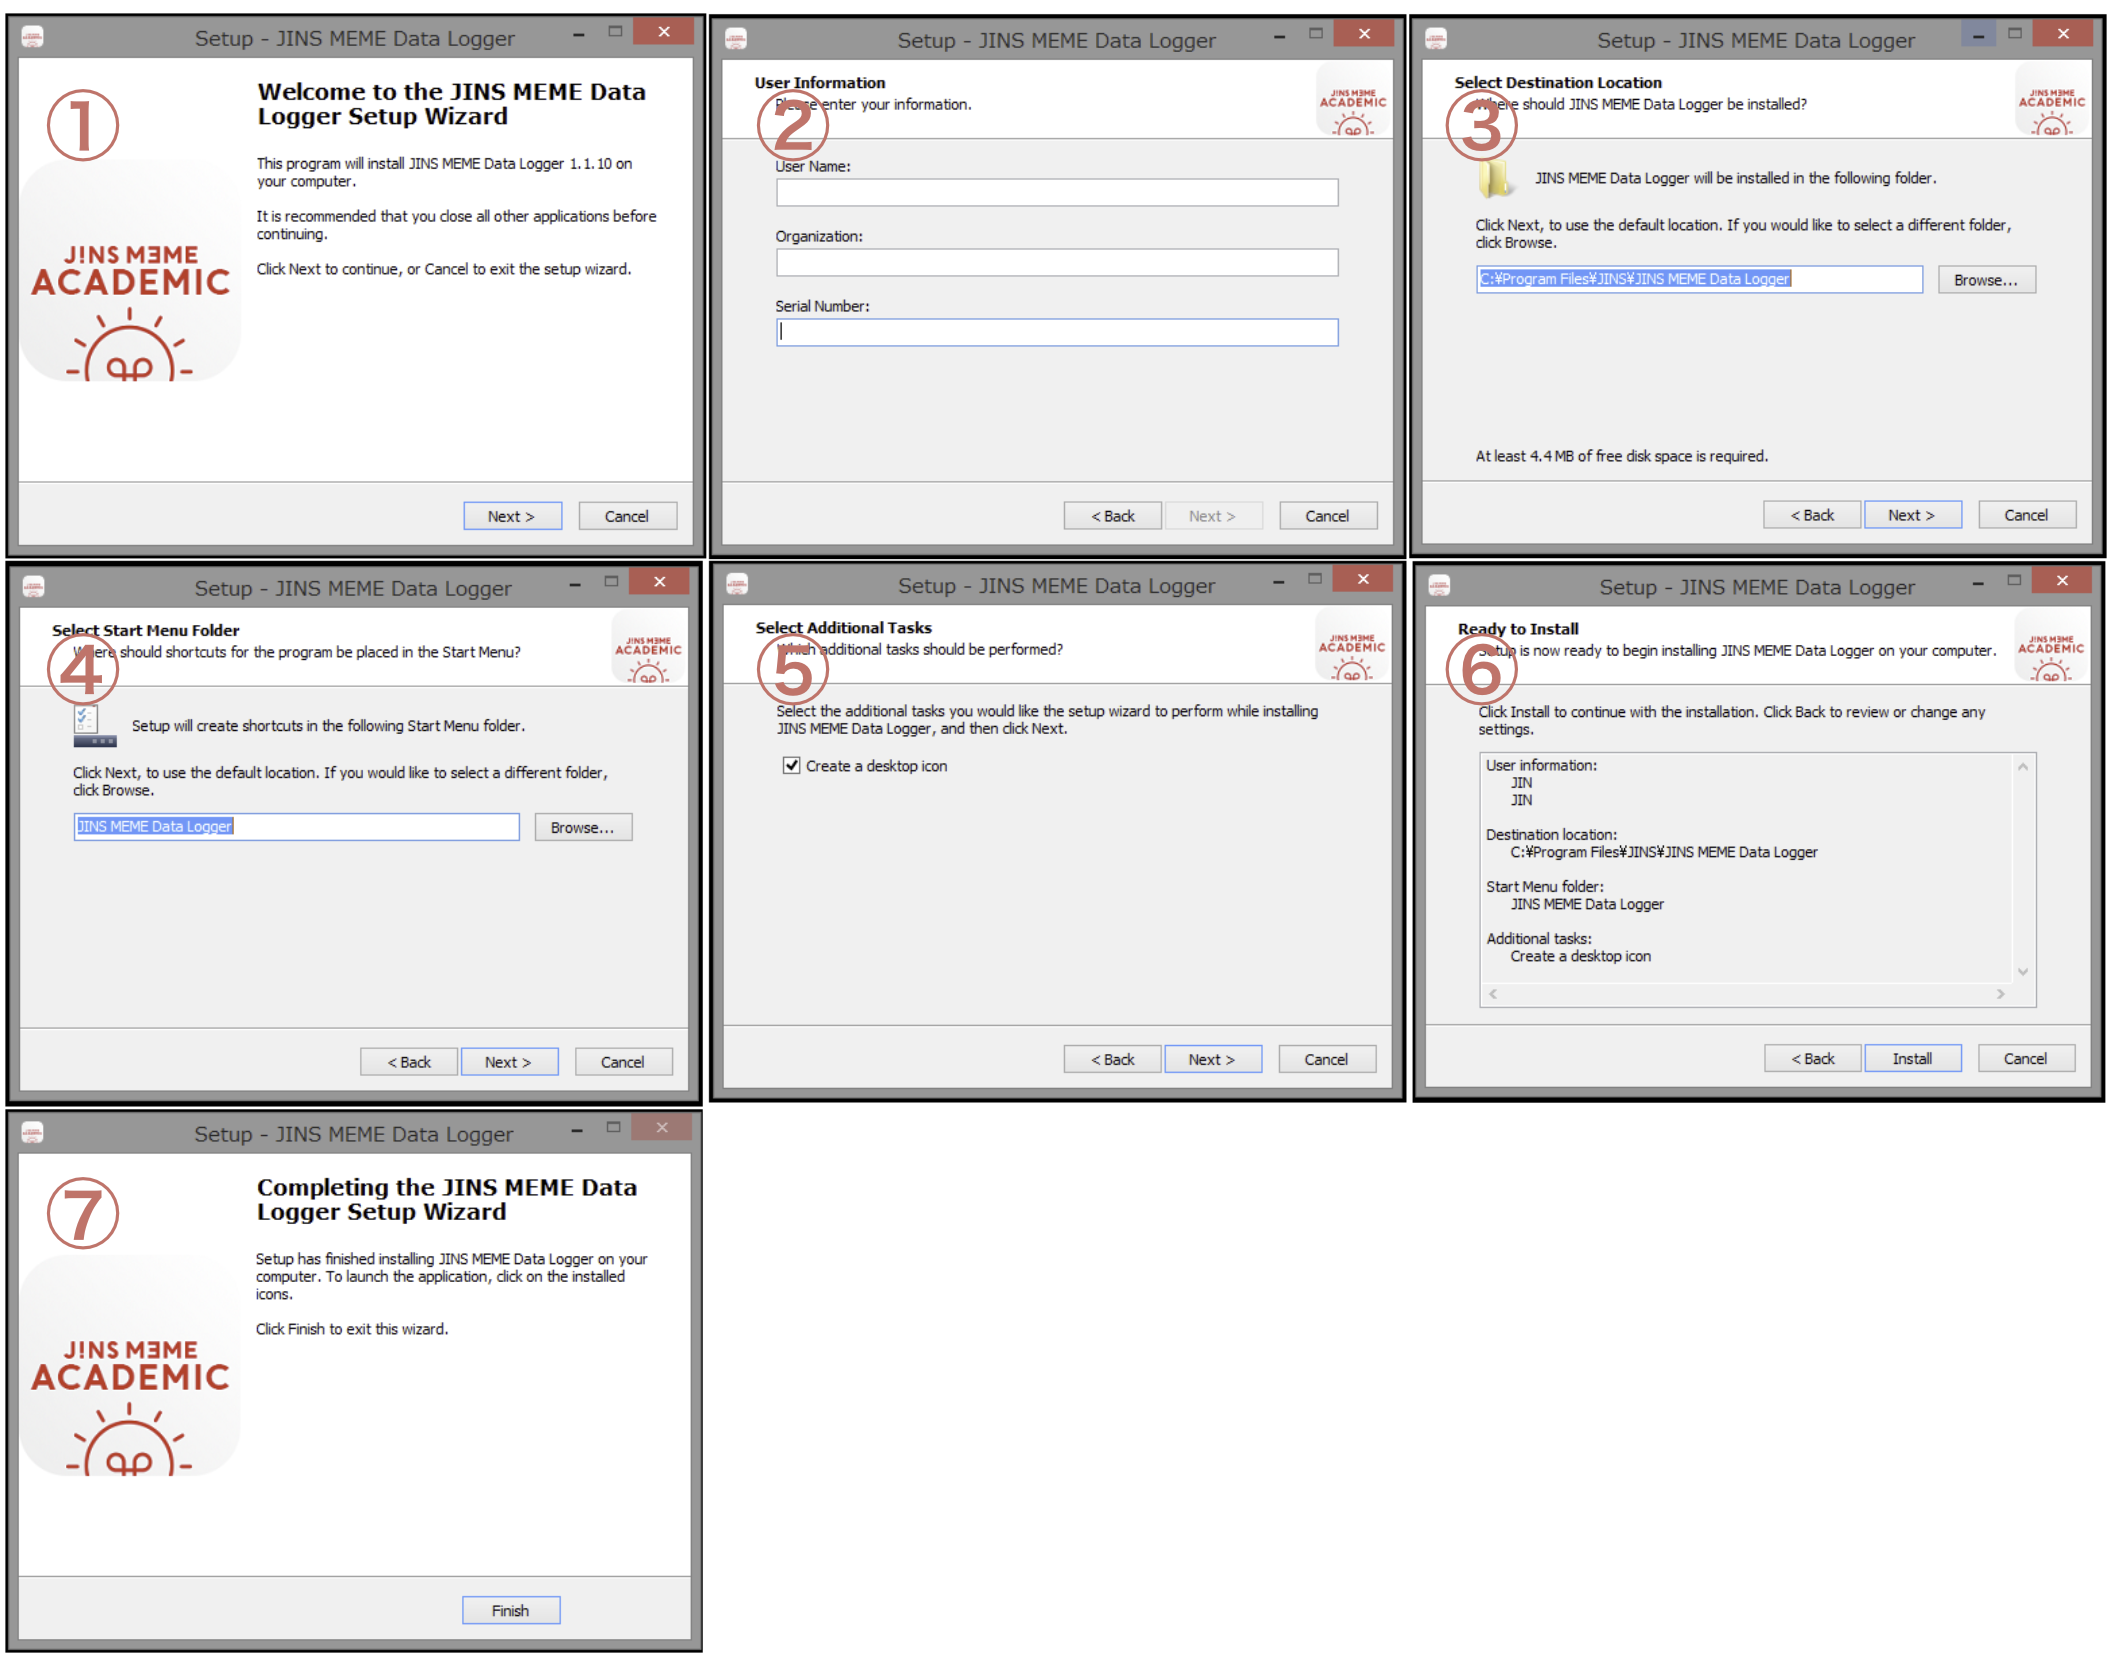
- Extract the zip file and double-click the file in the app folder. Check the software version and click the Next > button.
ImportantIf you are logged in with a non-administrator account, the [User Account Control] window appears. Request the administrator to perform the installation if you wish to continue.
- Enter the user name, organization name, and serial number and click the Next > button.
- Specify the software installation destination and click the Next > button.
- Specify the folder name to register on the Start menu and click the Next > button.
- Specify creation of desktop icon and click the Next > button.
- Check the input information and click the Install button.
- When the Installation Completed window appears, click the Finish button and close window.
To uninstall, delete the app from the application list.
MacOS
- Extract the zip file.
- Move the file to a Application folder.
- Execute the executable file.
To uninstall, delete the app from the application folder.
Measurement flow
In order to use the functions of the JINS MEME ES_R, communication must be established between PC and the JINS MEME ES_R.
Connection
Connecting the Dongle (Windows only)
- Insert the dongle in any USB port on the PC.
ImportantIf the dongle driver is not found, try the CP210x USB - UART bridge VCP driver provided by Silicon labs.
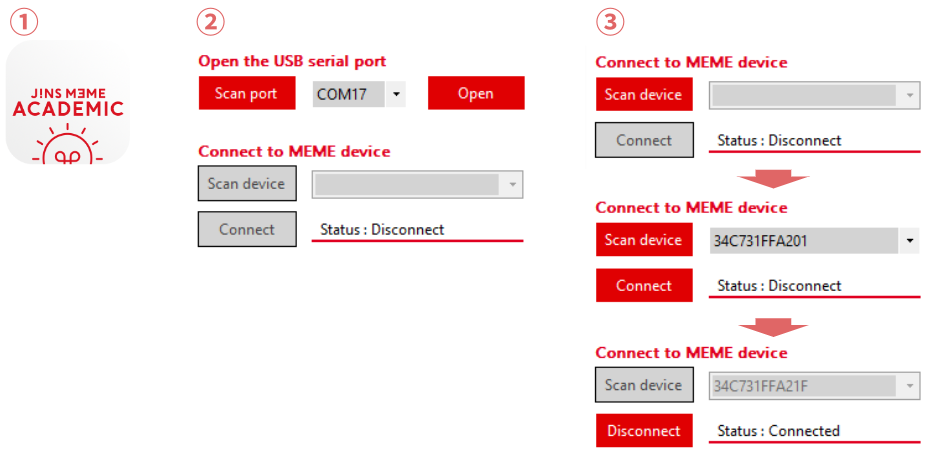
① Launch the app
- Click the JINS MEME ACADEMIC icon and start the software.
- The Acquire Data window appears.
② Dongle and port settings (Windows only)
- Click the
Scan portbutton to search the dongle.- The combo box shows the port number of the USB.
- Select the destination port number from the list and click the Open button.
- The
Openbutton changes to theClosebutton and dongle communication is established.
- The
③ Connecting with the JINS MEME ES_R
- When a connectable JINS MEME ES_R is nearby, click the
Scandevice button will start scanning for a connectable JINS MEME ES_R. - The combo box shows the ID of the connectable JINS MEME ES_R.
- Select the JINS MEME ES_R to connect to and click the
Connectbutton. - The status text changes to the
Connectedand communication is established.- Connection may fail depending on the compatibility with the PC. If the connection fails, please try to connect again.
Measurement
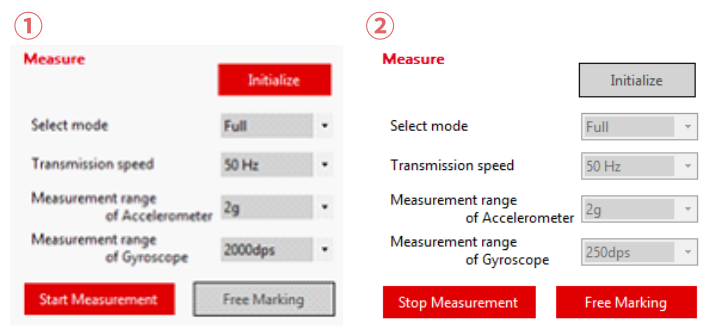
- Start measurement
- Specify the Select mode, Transmission speed, Measurement range of Accelerometer, and Measurement range of Gyroscope, and click the
Start Measurementbutton to send measurement values from the JINS MEME ES_R and start drawing graphs. TipRefer to "Review Data window" for the details of each item.ImportantNo graph is drawn when Quaternion is selected for Select mode.
- Specify the Select mode, Transmission speed, Measurement range of Accelerometer, and Measurement range of Gyroscope, and click the
- Stopping Measurement
- Click the
Stop Measurementbutton while measuring to stop measurement.
- Click the
Disconnection
- Disconnecting Communication of the JINS MEME ES_R
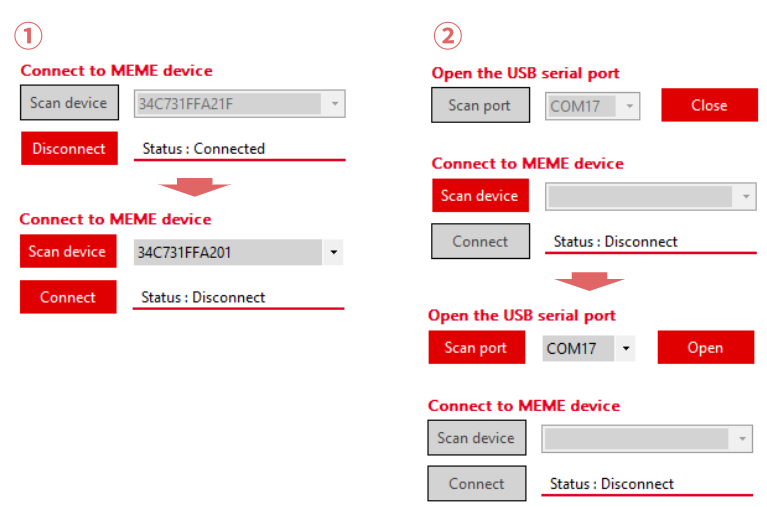
- Click the
Disconnectbutton while measurement with the JINS MEME ES_R is stopped. - The
Disconnectbutton changes to theConnectbutton and communication is disconnected.
- Click the
- Disconnecting Communication with the Dongle (Windows only)
- While dongle communication is established from any USB port, click the
Closebutton. - The
Closebutton changes to theOpenbutton and dongle communication is disconnected.
- While dongle communication is established from any USB port, click the
User Interface
Acquire Data window
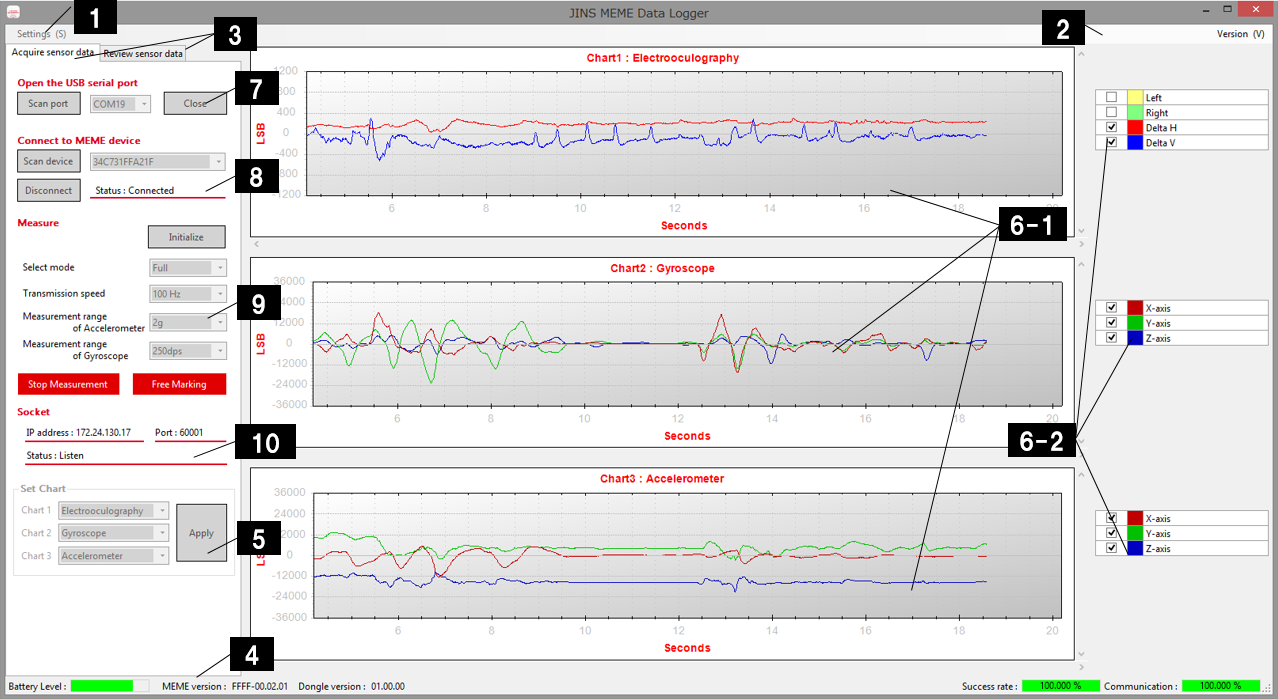
| No | Name | Item | Description |
|---|---|---|---|
| 1 | Settings(S) | Displays the Settings window (described later). (* Disabled during dongle communication.) | |
| 2 | Version(V) | Displays the Version Information window. | |
| 3 | Switch tab | Switches between the Acquire Sensor Data tab and the Review Sensor Data tab. | |
| 4 | Status bar | Battery Level | Displays the five step battery level of the measuring instrument during measurement. |
| MEME Version | Displays the version information of the connected JINS MEME ES_R. | ||
| Dongle Version | Displays the version information of the connected dongle. | ||
| Success rate | Displays the data acquisition rate from the start of the measurement. | ||
| Communication | Displays the data acquisition rate for the last 200m seconds. | ||
| 5 | Graph type setting | Sets the type of graph to display. Select one of the following types from the combo box and click the [Apply] button to apply to the graph. | |
| Hide | Hide the graph. | ||
| Accelerometer | Display the accelerometer sensor values. | ||
| Gyroscope | Display the gyroscope sensor values. | ||
| Electrooculography | Display the electrooculography sensor values. | ||
| 6-1 | Graphs | Displays the graphs. Use the mouse to zoom or scroll while the measurement is stopped. | |
| Zoom | Left click the mouse on the graph and use the mouse wheel to zoom in/out. | ||
| Scroll | Left click the mouse on the graph and drag the mouse to scroll. | ||
| 6-2 | Graph Legend data selection | Displays/hides legend data graph. | |
| Checked | Display the graph. | ||
| Unchecked | Hide the graph. | ||
| 7 | Dongle connection | Connects the dongle. | |
| Scan Port | Scan for the dongle port. | ||
| Combo box | Display and select from the dongle port list. | ||
| Connect/Close | Connect/disconnect the dongle. | ||
| 8 | JINS MEME ES_R connection | Connect the JINS MEME ES_R. | |
| Scan Device | Scan for the JINS MEME ES_R. | ||
| Combo box | Display and select the JINS MEME ES_R list. | ||
| Connect/Disconnect | Connect/disconnect the JINS MEME ES_R. The connection status appears in [Status]. | ||
| 9 | Data Acquisition Control | Sets and controls the measuring instrument. ※No graph is drawn when Quaternion is selected. The measurement mode can still be selected. | |
| Initialize | Initialize the measuring range and communication speed setting. | ||
| Select Mode | Select the measurement mode. The operating sensor and sampling frequency in each mode are shown in the table below. | ||
| Transmission Speed | Select the Bluetooth communication speed between the JINS MEME ES_R and the dongle. Select 100Hz or 50Hz. 50Hz enables more stable data acquisition. | ||
| Measurement range of Accelerometer | Select the accelerometer sensor measurement range: ±2, ±4, ±8, or ±16g. | ||
| Measurement range of Gyroscope | Select the gyroscope sensor range: ±250, ±500, ±1000, or ±2000. | ||
| Start Measurement / Stop Measurement | Instruct the JINS MEME ES_R to start/stop measurement. The acquired data is stored in the following location:\Documents\JINS\MEMEacademic\SensorDataRefer to section [TCP Socket Communication Receive Format] for the content of the recorded data. | ||
| Free Marking | Add artifacts to the measurement data. "x" will be entered in the Column A of the csv file containing the measurement data. | ||
| 10 | TCP Socket communication | Displays the TCP socket communication status. | |
| IP address | IP address for the TCP socket communication. | ||
| Port | Port number for the TCP socket communication. | ||
| Status | Displays the status of the TCP socket communication. |
Select Mode: operating sensor and sampling frequency for each mode
| Mode | Operating sensor | Sampling frequency |
|---|---|---|
| Full mode | Electrooculography sensor | 100Hz |
| Accelerometer sensor | 100Hz | |
| Gyroscope sensor | 100Hz | |
| Standardmode | Electrooculography sensor | 200Hz |
| Accelerometer sensor | 100Hz | |
| Quaternion | — | 100Hz |
Review Data window (Only for Windows App)
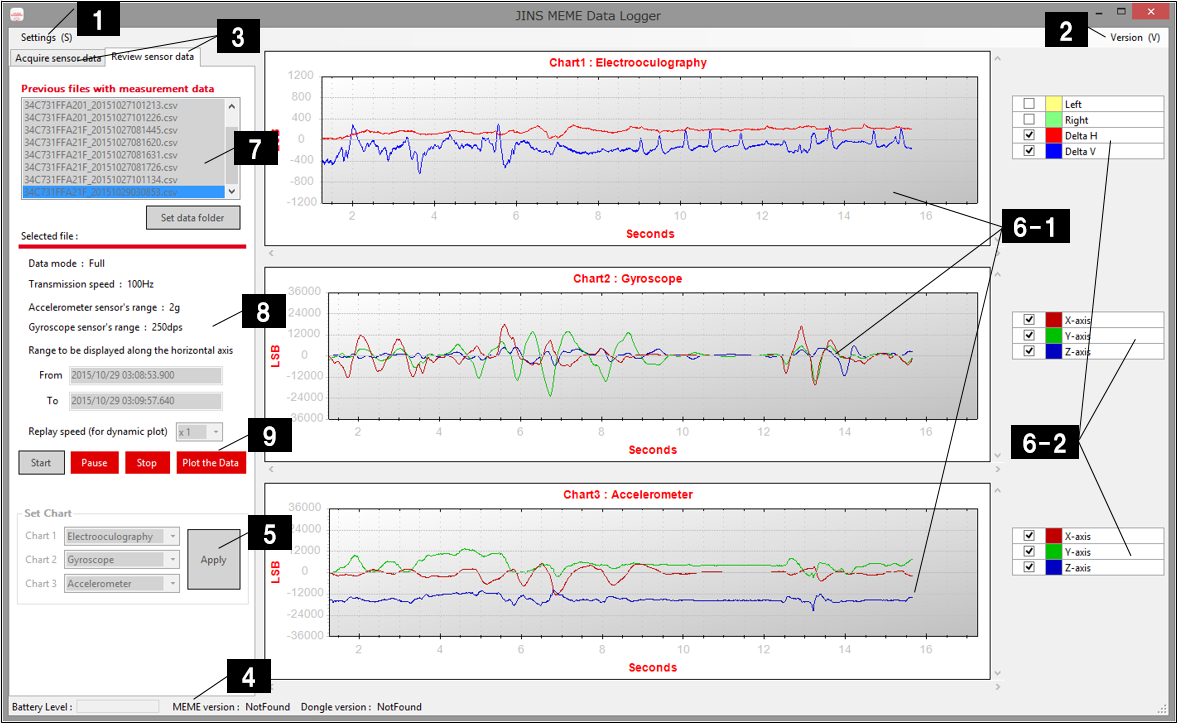
| No. | Name | Item | Description |
|---|---|---|---|
| 1 | Settings(S) | Displays the Settings window (described later). (※Disabled during dongle communication.) | |
| 2 | Version(V) | Displays the Version Information window. | |
| 3 | Switch tab | Switches between the Acquire Sensor Data tab and the Review Sensor Data tab. | |
| 4 | Status bar | Battery Level | Displays the five step battery level of the measuring instrument during measurement. |
| MEME Version | Displays the version information of the connected JINS MEME ES_R. | ||
| Dongle Version | Displays the version information of the connected dongle. | ||
| 5 | Graph type setting | Sets the type of graph to be displayed. Select one of the following types from the combo box and click the [Apply] button to apply to the graph. | |
| Hide | Hide the graph. | ||
| Accelerometer | Display the accelerometer sensor values. | ||
| Gyroscope | Display the gyroscope sensor values. | ||
| Electrooculography | Display the electrooculography sensor values. | ||
| 6-1 | Graphs | Displays the graphs. Use the mouse to zoom or scroll while measurement is stopped. | |
| Zoom | Left click the mouse on the graph and use the mouse wheel to zoom in/out. | ||
| Scroll | Left click the mouse on the graph and drag the mouse to scroll. | ||
| 6-2 | Graph Legend data selection | Displays/hides the legend data graph. | |
| Checked | Display the graph. | ||
| Unchecked | Hide the graph. | ||
| 7 | Acquire/Select File | Acquires and displays a list of files containing measurement data. (※Disabled during dongle communication.) | |
| Previous files with measurement data | Displays a list of acquired file names. | ||
| Set data folder | Displays a dialog box to specify the file acquisition destination folder. | ||
| 8 | Selected file information | Displays information of the file selected from the file list. | |
| Data mode | Displays the measurement mode. | ||
| Transmission Speed | Displays the Bluetooth communication speed between the JINS MEME ES_R and the dongle. | ||
| Accelerometer sensor's range | Displays the accelerometer sensor measurement range. | ||
| Gyroscope sensor's range | Displays the gyroscope sensor measurement range. | ||
| From | Displays the date and time (GMT) the measurement is started. | ||
| To | Displays the date and time (GMT) the measurement is stopped. | ||
| 9 | File review | Reviews the selected file. | |
| Replay Speed | Set the dynamic review replay speed. | ||
| Start | Start the dynamic review. | ||
| Pause/Resume | Pause or resume the dynamic review. | ||
| Stop | Stop the dynamic review. | ||
| Plot the Data | Click the [Start] button and then the [Plot the Data] button to batch load the file data and display statically. |
Settings window
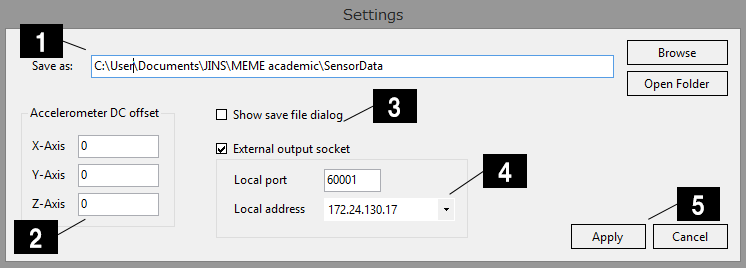
| No. | Name | Item | Description |
|---|---|---|---|
| 1 | Sensor Data Save folder | Specifies the folder in which to save the sensor data. | |
| Browse | Display the folder selection dialog and specify the save destination. | ||
| Open Folder | Open the save destination folder in Explorer. | ||
| 2 | Acceleration DC offset | Specifies the offset to display the acceleration sensor data as graph. The sensor raw data will be saved as a file. (offset is excluded) | |
| X-Axis | Specify the X-axis offset. | ||
| Y-Axis | Specify the Y-axis offset. | ||
| Z-Axis | Specify the Z-axis offset. | ||
| 3 | Show save file dialog | Displays/hides the Change Save File Name dialog when the measurement is complete. | |
| Checked | Display the Change Save File Name dialog. | ||
| Unchecked | Hide the Change Save File Name dialog. The default name is used. ([BLT-address]_[record start datetime].csv) | ||
| 4 | TCP socket communication | Enable/disable TCP socket communication. Refer to section [TCP Socket communication Receive Format] for the content of the recorded data. | |
| Checked | Enable TCP socket communication and setting of IP address and Port number. | ||
| Unchecked | Disable TCP socket communication. | ||
| 5 | Apply/Cancel | Saves or cancels the parameters specified in this window. |
TCP Socket Communication
The socket communication log file consists of two parts: the header containing the measurement information and the body containing the sensing data. The header contains the measurement information "Data mode, Transmission speed, Accelerometer sensor's range, Gyroscope sensor's range, and data rank" respectively.
For Select mode "Full", Transmission speed "100Hz", Measurement range of Accelerometer "±4g", and Measurement range of Gyroscope "1000dps"
//Data mode  : Full
//Transmission speed  : 100Hz
//Acceleration sensor's range  : 4g
//Gyroscope sensor's range  : 1000dps
//ARTIFACT,NUM,DATE,ACC_X,ACC_Y,ACC_Z,GYRO_X,GYRO_Y,GYRO_Z,EOG_L,EOG_R,EOG_H,EOG_V
■Data Rank in each Measurement Mode
1. When Measurement mode is "Standard"
//ARTIFACT,NUM,DATE,ACC_X,ACC_Y,ACC_Z,EOG_L1,EOG_R1,EOG_L2,EOG_R2,EOG_H1,EOG_H2,EOG_V1,EOG_V2Description
Artifact, Total count, Measurement date/time, Acceleration sensor value (X-axis), Acceleration sensor value (Y-axis), Acceleration sensor value (Z-axis), EOG sensor value 1 (left), EOG sensor value 1 (right), EOG sensor value 2 (left), EOG sensor value 2 (right), EOG sensor value 1 (horizontal difference), EOG sensor value 2 (horizontal difference), EOG sensor value 1 (vertical difference), EOG sensor value 2 (vertical difference)
// Data mode  : Standard
// Transmission speed  : 50Hz
// Acceleration sensor's range  : 2g
// Gyroscope sensor's range  : 250dps
//
//ARTIFACT,NUM,DATE,ACC_X,ACC_Y,ACC_Z,EOG_L1,EOG_R1,EOG_L2,EOG_R2,EOG_H1,EOG_H2,EOG_V1,EOG_V2
,1,2016/03/15 01:25:10.85,790,329,16523,-59,-189,-21,-165,130,144,124,93
,2,2016/03/15 01:25:10.87,746,369,16503,-42,-158,-7,-153,116,146,100,80
,3,2016/03/15 01:25:10.89,801,302,16553,-48,-161,-16,-152,113,136,104,84
2. When Measurement mode is "Full"
//ARTIFACT,NUM,DATE,ACC_X,ACC_Y,ACC_Z,GYRO_X,GYRO_Y,GYRO_Z,EOG_L,EOG_R,EOG_H,EOG_VDescription
Artifact, Total count, Measurement date/time, Acceleration sensor value (X-axis), Acceleration sensor value (Y-axis), Acceleration sensor value (Z-axis), Angular velocity sensor value (X-axis), Angular velocity sensor value (Y-axis), Angular velocity sensor value (Z-axis), EOG sensor value (left), EOG sensor value (right), EOG sensor value (horizontal difference), EOG sensor value (vertical difference)
// Data mode  : Full
// Transmission speed  : 100Hz
// Acceleration sensor's range  : 2g
// Gyroscope sensor's range  : 250dps
//
//ARTIFACT,NUM,DATE,ACC_X,ACC_Y,ACC_Z,GYRO_X,GYRO_Y,GYRO_Z,EOG_L,EOG_R,EOG_H,EOG_V
,1,2016/03/15 01:26:07.23,780,254,16542,0,33,-66,4,-171,175,83
,2,2016/03/15 01:26:07.24,737,293,16559,-7,11,-79,12,-150,162,69
,3,2016/03/15 01:26:07.25,896,249,16539,15,34,-58,-9,-196,187,102
3. When measurement mode is "Quaternion"
// Data mode  : Quaternion
// Transmission speed  : Standard
// Acceleration sensor's range  : 2g
// Gyroscope sensor's range  : 2000dps
//
//ARTIFACT,NUM,DATE,QUATERNION_W,QUATERNION_X,QUATERNION_Y,QUATERNION_Z
Description Artifact, Total count, Measurement date/time, Quaternion (W) Quaternion (X) Quaternion (Y) Quaternion (Z)
// Data mode  : Quaternion
// Transmission speed  : 50Hz
// Acceleration sensor's range  : 2g
// Gyroscope sensor's range  : 2000dps
//
//ARTIFACT,NUM,DATE,QUATERNION_W,QUATERNION_X,QUATERNION_Y,QUATERNION_Z
,1,2016/3/21 15:51:53.32,13931501,1065299619,133555066,-5213924
,2,2016/3/21 15:51:53.34,13930073,1065376001,132938877,-5356280
,3,2016/3/21 15:51:53.36,13922096,1065454235,132305442,-549757
Socket client sample
Below is a sample of data reception in Python.
import socket
target_ip = "127.0.0.1" #Change here
target_port = 60000 #Change here
buffer_size = 4096

# 1.Creating a Socket Object
tcp_client = socket.socket(socket.AF_INET, socket.SOCK_STREAM)
print("tcp_client = socket.socket(socket.AF_INET, socket.SOCK_STREAM)")

# 2.Connect to Server
tcp_client.connect((target_ip,target_port))
print("tcp_client.connect((target_ip,target_port))")

is_end = False
while not is_end:
    # 3.Receive response from server
    response = tcp_client.recv(buffer_size)
    if response == b"":
        is_end = True
    print("[*]Received a response : {}".format(response))

# 4.Terminate the connection
tcp_client.close()