User InterfaceAcademic
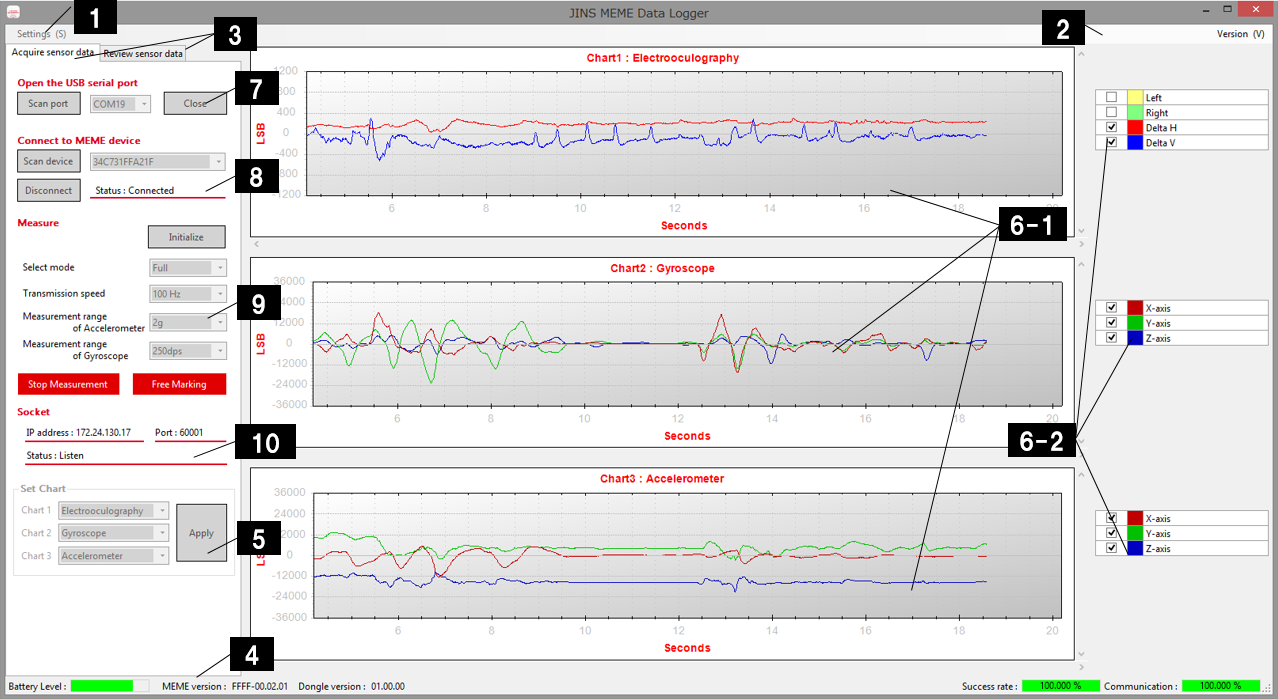
Acquire Data window
| No | Name | Item | Description |
|---|---|---|---|
| 1 | Settings(S) | Displays the Settings window (described later). (* Disabled during dongle communication.) | |
| 2 | Version(V) | Displays the Version Information window. | |
| 3 | Switch tab | Switches between the Acquire Sensor Data tab and the Review Sensor Data tab. | |
| 4 | Status bar | Battery Level | Displays the five step battery level of the measuring instrument during measurement. |
| MEME Version | Displays the version information of the connected JINS MEME ES_R. | ||
| Dongle Version | Displays the version information of the connected dongle. | ||
| Success rate | Displays the data acquisition rate from the start of the measurement. | ||
| Communication | Displays the data acquisition rate for the last 200m seconds. | ||
| 5 | Graph type setting | Sets the type of graph to display. Select one of the following types from the combo box and click the [Apply] button to apply to the graph. | |
| Hide | Hide the graph. | ||
| Accelerometer | Display the accelerometer sensor values. | ||
| Gyroscope | Display the gyroscope sensor values. | ||
| Electrooculography | Display the electrooculography sensor values. | ||
| 6-1 | Graphs | Displays the graphs. Use the mouse to zoom or scroll while the measurement is stopped. | |
| Zoom | Left click the mouse on the graph and use the mouse wheel to zoom in/out. | ||
| Scroll | Left click the mouse on the graph and drag the mouse to scroll. | ||
| 6-2 | Graph Legend data selection | Displays/hides legend data graph. | |
| Checked | Display the graph. | ||
| Unchecked | Hide the graph. | ||
| 7 | Dongle connection | Connects the dongle. | |
| Scan Port | Scan for the dongle port. | ||
| Combo box | Display and select from the dongle port list. | ||
| Connect/Close | Connect/disconnect the dongle. | ||
| 8 | JINS MEME ES_R connection | Connect the JINS MEME ES_R. | |
| Scan Device | Scan for the JINS MEME ES_R. | ||
| Combo box | Display and select the JINS MEME ES_R list. | ||
| Connect/Disconnect | Connect/disconnect the JINS MEME ES_R. The connection status appears in [Status]. | ||
| 9 | Data Acquisition Control | Sets and controls the measuring instrument. ※No graph is drawn when Quaternion is selected. The measurement mode can still be selected. | |
| Initialize | Initialize the measuring range and communication speed setting. | ||
| Select Mode | Select the measurement mode. The operating sensor and sampling frequency in each mode are shown in the table below. | ||
| Transmission Speed | Select the Bluetooth communication speed between the JINS MEME ES_R and the dongle. Select 100Hz or 50Hz. 50Hz enables more stable data acquisition. | ||
| Measurement range of Accelerometer | Select the accelerometer sensor measurement range: ±2, ±4, ±8, or ±16g. | ||
| Measurement range of Gyroscope | Select the gyroscope sensor range: ±250, ±500, ±1000, or ±2000. | ||
| Start Measurement / Stop Measurement | Instruct the JINS MEME ES_R to start/stop measurement. The acquired data is stored in the following location:\Documents\JINS\MEMEacademic\SensorDataRefer to section [TCP Socket Communication Receive Format] for the content of the recorded data. | ||
| Free Marking | Add artifacts to the measurement data. "x" will be entered in the Column A of the csv file containing the measurement data. | ||
| 10 | TCP Socket communication | Displays the TCP socket communication status. | |
| IP address | IP address for the TCP socket communication. | ||
| Port | Port number for the TCP socket communication. | ||
| Status | Displays the status of the TCP socket communication. |
Select Mode: operating sensor and sampling frequency for each mode
| Mode | Operating sensor | Sampling frequency |
|---|---|---|
| Full mode | Electrooculography sensor | 100Hz |
| Accelerometer sensor | 100Hz | |
| Gyroscope sensor | 100Hz | |
| Standardmode | Electrooculography sensor | 200Hz |
| Accelerometer sensor | 100Hz | |
| Quaternion | — | 100Hz |
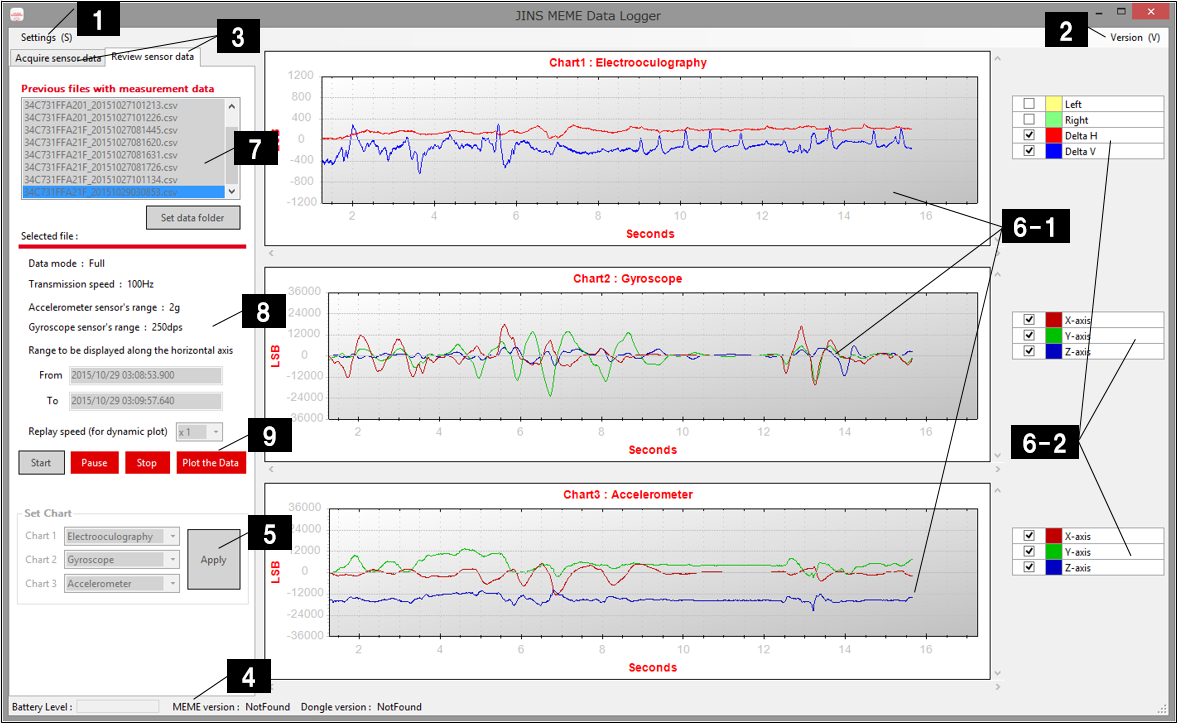
Review Data window (Only for Windows App)
| No. | Name | Item | Description |
|---|---|---|---|
| 1 | Settings(S) | Displays the Settings window (described later). (※Disabled during dongle communication.) | |
| 2 | Version(V) | Displays the Version Information window. | |
| 3 | Switch tab | Switches between the Acquire Sensor Data tab and the Review Sensor Data tab. | |
| 4 | Status bar | Battery Level | Displays the five step battery level of the measuring instrument during measurement. |
| MEME Version | Displays the version information of the connected JINS MEME ES_R. | ||
| Dongle Version | Displays the version information of the connected dongle. | ||
| 5 | Graph type setting | Sets the type of graph to be displayed. Select one of the following types from the combo box and click the [Apply] button to apply to the graph. | |
| Hide | Hide the graph. | ||
| Accelerometer | Display the accelerometer sensor values. | ||
| Gyroscope | Display the gyroscope sensor values. | ||
| Electrooculography | Display the electrooculography sensor values. | ||
| 6-1 | Graphs | Displays the graphs. Use the mouse to zoom or scroll while measurement is stopped. | |
| Zoom | Left click the mouse on the graph and use the mouse wheel to zoom in/out. | ||
| Scroll | Left click the mouse on the graph and drag the mouse to scroll. | ||
| 6-2 | Graph Legend data selection | Displays/hides the legend data graph. | |
| Checked | Display the graph. | ||
| Unchecked | Hide the graph. | ||
| 7 | Acquire/Select File | Acquires and displays a list of files containing measurement data. (※Disabled during dongle communication.) | |
| Previous files with measurement data | Displays a list of acquired file names. | ||
| Set data folder | Displays a dialog box to specify the file acquisition destination folder. | ||
| 8 | Selected file information | Displays information of the file selected from the file list. | |
| Data mode | Displays the measurement mode. | ||
| Transmission Speed | Displays the Bluetooth communication speed between the JINS MEME ES_R and the dongle. | ||
| Accelerometer sensor's range | Displays the accelerometer sensor measurement range. | ||
| Gyroscope sensor's range | Displays the gyroscope sensor measurement range. | ||
| From | Displays the date and time (GMT) the measurement is started. | ||
| To | Displays the date and time (GMT) the measurement is stopped. | ||
| 9 | File review | Reviews the selected file. | |
| Replay Speed | Set the dynamic review replay speed. | ||
| Start | Start the dynamic review. | ||
| Pause/Resume | Pause or resume the dynamic review. | ||
| Stop | Stop the dynamic review. | ||
| Plot the Data | Click the [Start] button and then the [Plot the Data] button to batch load the file data and display statically. |
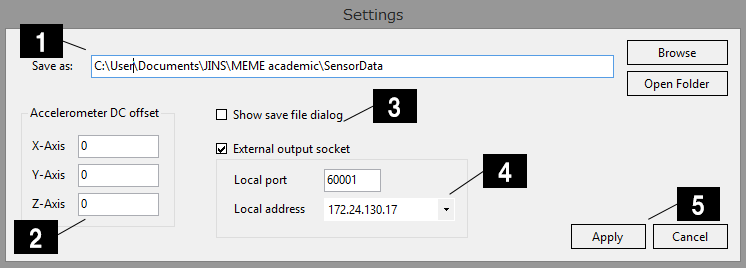
Settings window
| No. | Name | Item | Description |
|---|---|---|---|
| 1 | Sensor Data Save folder | Specifies the folder in which to save the sensor data. | |
| Browse | Display the folder selection dialog and specify the save destination. | ||
| Open Folder | Open the save destination folder in Explorer. | ||
| 2 | Acceleration DC offset | Specifies the offset to display the acceleration sensor data as graph. The sensor raw data will be saved as a file. (offset is excluded) | |
| X-Axis | Specify the X-axis offset. | ||
| Y-Axis | Specify the Y-axis offset. | ||
| Z-Axis | Specify the Z-axis offset. | ||
| 3 | Show save file dialog | Displays/hides the Change Save File Name dialog when the measurement is complete. | |
| Checked | Display the Change Save File Name dialog. | ||
| Unchecked | Hide the Change Save File Name dialog. The default name is used. ([BLT-address]_[record start datetime].csv) | ||
| 4 | TCP socket communication | Enable/disable TCP socket communication. Refer to section [TCP Socket communication Receive Format] for the content of the recorded data. | |
| Checked | Enable TCP socket communication and setting of IP address and Port number. | ||
| Unchecked | Disable TCP socket communication. | ||
| 5 | Apply/Cancel | Saves or cancels the parameters specified in this window. |